Edge
Sam Whitaker · 8 services
- api-gateway1,240 req/s · 38 ms · 0.02%
- cdn-edge3,900 req/s · 12 ms · 0.00%
- rate-limiter1,240 req/s · 2 ms · 0.00%
+5 more
 Porthole
 collects every trace, metric, log and profile, follows each slow request to the query or deploy behind it, readies the fix, and archives your logs in your own bucket.
100% free, open source alternative to Datadog, New Relic and Grafana Cloud
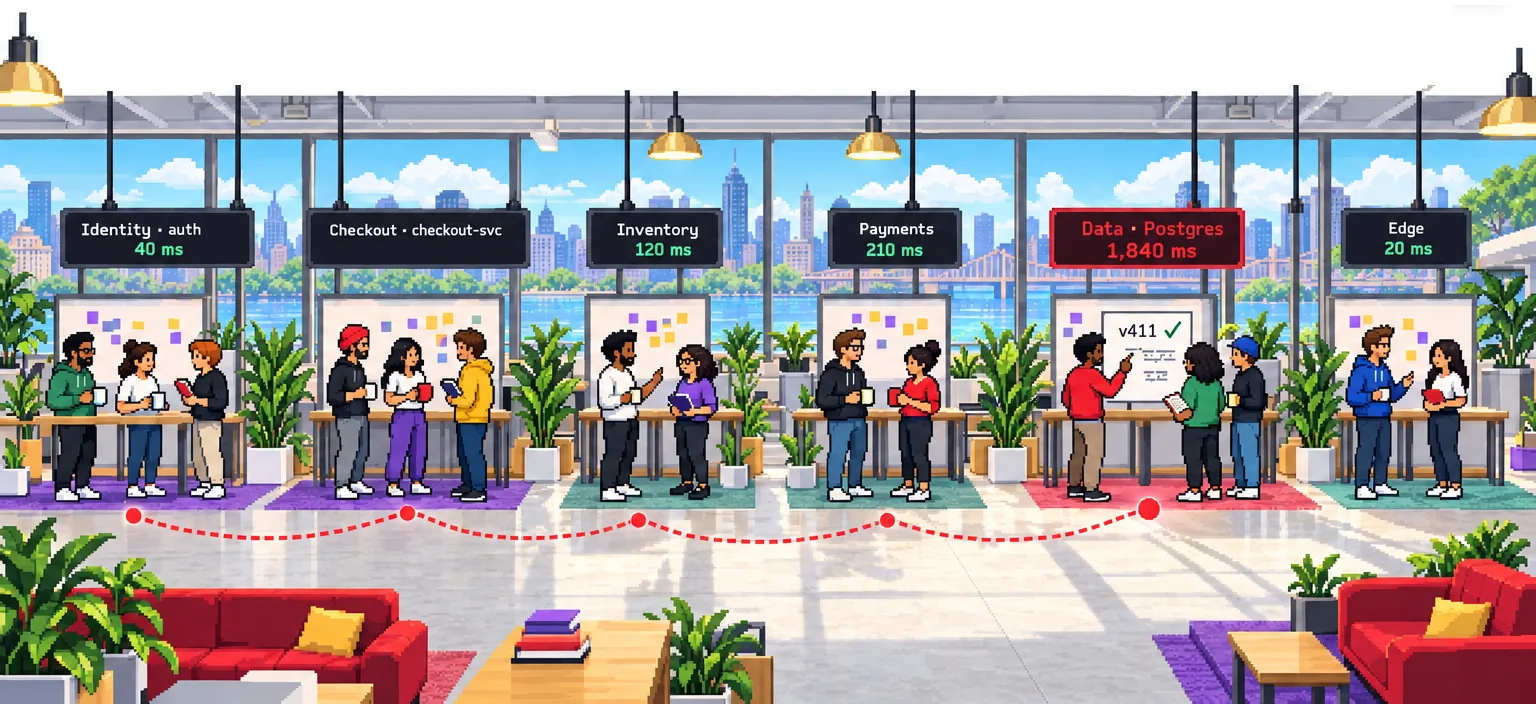






Service map · six teams · Mon Oct 19
Every service was discovered from its own traffic, with its owner, rate, p95 and errors. The checkout path runs through all six teams.
Checkout path: api-gateway → auth, checkout-svc
checkout-svc → inventory-svc, orders-db, payments-svc
Sam Whitaker · 8 services
+5 more
Grace Liu · 6 services
+3 more
Dana Brooks · 7 services
+4 more
Tomás Rivera · 9 services
+6 more
Ben Okafor · 8 services
+5 more
Ana Ruiz · 8 services
+5 more
Trace · Checkout and Data · Wed Oct 21 · 2:14 pm ET
One click from the slow checkout to its trace, the query that held it, the plan and the deploy that changed it.
0 … 2,400 ms
SELECT id, status, total FROM orders
WHERE customer_id = $1 AND created_at > $2
Seq Scan on orders · 9,412,077 rows removed by filter · 3 returned
Ben · Data
traceparent 00-7f3a…c21
→ this trace
97% off-CPU · 82% in pgx Query (1,840 of 2,250 ms)
PR #3391 ‘drop unused orders indexes’
migration 0412 drops orders_customer_id_idx
Index gone in v412.
Slow traces since 1:58 pm share: db.statement orders by customer_id (100% vs 0% before) · service.version v412 (100%)
Incident · Checkout · Wed Oct 21 · 1:58 – 2:31 pm ET
The agent tested five causes and posted the one that held, with its queries, three minutes after the page. It readied the rollback, and Dana approved it in Slack.
checkout-svc → v411 · reverts migration 0412
rebuilds orders_customer_id_idx without locking writes · about 7 min · no data changed
Dana Brooks approved · Slack · 2:22 pm
2:34 pm · follow-up CHK-482 filed in Vector · Thu Oct 22 · v413 shipped with the index kept
Kubernetes · Inventory · Tue Oct 20 · ET
The nightly reindex outgrew its memory while search kept serving Monday’s index, so nobody was paged. The agent found why and opened the fix; Tomás merged it at 9:12.
2:30 – 4:00 am
9:00 – 10:00 am
3:07:41 am · in Porthole at 3:08:02
owner: Inventory
Catalog grew 1.84M → 2.41M SKUs since Mon Sep 14 (+31%)
each run now peaks above the 2 GiB limit
search-api still serving Monday’s index · no customer impact
memory limit 2 GiB → 3 GiB, request 1.5 → 2.5 GiB
node has 5.2 GiB unrequested
opened by the agent 3:14 am
Tomás Rivera merged · 9:12 am
Argo CD synced 9:14 am

Tue Oct 20 · 3:07 am · search-indexer killed · search kept serving · nobody paged
Coverage and noise · Payments, Identity and Edge · Tue Oct 20 – Fri Oct 23
billing-worker had sent logs but never a trace. The agent wrote the instrumentation as a pull request, and Ana merged it Thursday.
Wed Oct 21
Python · Kafka consumer
logs only · 0 spans since Mon Oct 12
Add OpenTelemetry tracing and Kafka context propagation
requirements.txt+1
+opentelemetry-distro==0.48b0worker/main.py+6 −2
worker/consumer.py+10
+from opentelemetry import trace+from opentelemetry.propagate import extract+tracer = trace.get_tracer("billing-worker") h = {k: v.decode() for k, v in msg.headers() or []}+ with tracer.start_as_current_span("invoice", context=extract(h)):Dockerfile+1
+ENV OTEL_SERVICE_NAME=billing-workerAna Ruiz merged · Thu Oct 22, 10:40 am
Merged.
Thu Oct 22
38 jobs/s · p95 1.2 s · 0.02% errors
traces from 11:05 am
46 of 46 services traced
checkout-svc → payments-svc → invoices.created → billing-worker
→ p99 > 250 ms for 10 min
replayed: 41 → 3, every real slowdown kept
PR #88 · Grace Liu merged Fri Oct 23, 2:10 pm
→ judged over 5-minute windows
replayed: 23 → 1, the real one kept
PR #89 · Sam Whitaker merged Fri Oct 23, 2:25 pm
Cost control · Checkout and Inventory · Wed Oct 14 and Mon Oct 26 · ET
Porthole watches what every team sends. A tag that multiplied one metric and a debug log nobody read were each caught, fixed by a pull request or a rule, and approved by their team.
Checkoutcheckout.latency · active series · Wed Oct 14
Agent · 11:04 am · PR #3307: group checkout.latency by route, keep user_id on spans
searching traces by user_id still works
Dana Brooks merged · 11:35 am
Inventorysearch-api · logs a day · Mon Oct 19 – Fri Oct 30
410 GB a day · 372 GB DEBUG · 0 searches on DEBUG lines Oct 12 – 25
Agent · Mon Oct 26, 9:05 am · drop DEBUG from search-api, keep every WARN and ERROR line
Tomás Rivera approved · 9:40 am
error lines kept
was 1,572 GB
Logs · Payments and Identity · Mon Nov 16 · ET
Every line is parsed, masked and linked to its trace on the way in. Fifteen days stay hot; the rest lives in your R2 bucket as Parquet, readable without Porthole.
payments-svc10:41:09 amcard verifycard 4111 1111 1111 1111customer 88412trace 5c2e…a90
level infomsg card verifycard 4111 1111 1111 1111customer_id 88412trace_id 5c2e…a90
card •••• •••• •••• 1111masked before indexing
searchable 15 days→ trace 5c2e…a90
r2://logs-archive/service=payments-svc/date=2026-11-16/Parquet
SOC 2 auditor asks for failed admin logins, Tue Oct 13 – Thu Oct 15.
auth logs Oct 13 – 15 · 96 GB from R2.
searchable at 10:08:40 am · 6 min 40 s
auditor role: read-only, auth logs only.
the same days read straight from R2.
37 failed admin logins · same count in Porthole
sent to Evidence
Moving in · from Datadog · Mon Oct 12 – Fri Oct 16 · ET
Marcus brought the floor’s dashboards, monitors and SLOs across on Monday, and three lines in the Datadog Agent’s Helm values sent all 212 hosts to Porthole too. Every alert fired in both tools all week.
{ "monitors": [
  { "name": "ledger sync lag",
    "type": "query alert",
    "query": "avg(last_5m):avg:ledger_sync.lag{service:ledger} > 30",
    "tags": ["service:ledger", "team:payments"] },
  { "name": "kafka-main consumer lag",
    "type": "query alert",
    "query": "avg(last_5m):max:kafka_lag.messages{service:kafka-main} > 10000",
    "tags": ["service:kafka-main", "team:data"] },
  … ],
"widgets": [ { "q": "avg:ledger_sync.lag{service:ledger}" } ] }67 of 70 translated · 3 flagged: 2 monitors on a custom Agent check, 1 dashboard widget
fixed by Marcus Reed Tue Oct 13
6 SLOs, one per team
× 38
38 alerts fired in both, Mon Oct 12 – Fri Oct 16 · each within 1 min · widest gap 48 s
values.yaml · datadog-agent · datadog.env9 clusters · 212 hosts
datadog: env: - {name: DD_ADDITIONAL_ENDPOINTS, value: '{"https://porthole-intake": ["porthole"]}'} - {name: DD_LOGS_CONFIG_ADDITIONAL_ENDPOINTS, value: '[{"api_key": "porthole", "Host": "porthole-intake", "Port": 443}]'} - {name: DD_APM_ADDITIONAL_ENDPOINTS, value: '{"https://porthole-intake": ["porthole"]}'}datadog: env: - {name: DD_ADDITIONAL_ENDPOINTS, value: '{"https://porthole-intake": ["porthole"]}'} - {name: DD_LOGS_CONFIG_ADDITIONAL_ENDPOINTS, value: '[{"api_key": "porthole", "Host": "porthole-intake", "Port": 443}]'} - {name: DD_APM_ADDITIONAL_ENDPOINTS, value: '{"https://porthole-intake": ["porthole"]}'}Datadog Agent and services’ OpenTelemetry SDKs unchanged · rolled out Mon Oct 12, 11:20 – 11:48 am by Sam Whitaker
Fri Oct 16, 4:00 pm · Agent repointed to Porthole · Porthole’s monitors page through Oncall
npx -y @runeditrun/rer dev just-every/run-porthole
✓ Porthole is readyNew Relic and Grafana dashboards, monitors and SLOs come across the same way.

100% free and open source. MIT licensed.